Another New York find: If the evolution of the NYC skyline and street grid interested you, you might also fall for this time-lapse movie by H. Caesar of his arrival in NYC by ship (click on “vimeo” in below player to watch the video at bigger size): A nice idea, to shoot time-lapse from a moving … Continue reading Time-lapse movie of shipping up to New York
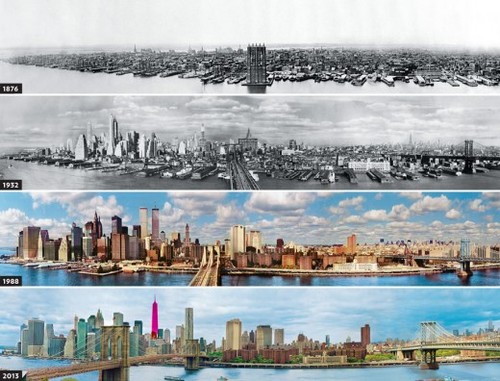
Interesting for history/urbanism/New York buffs: The evolution of the New York skyline and The evolution of the New York street grid (review of a book): The Commissioner’s Plan of 1811, the map and surveying scheme that set the blocks at 200 by 800 feet all the way up the length of the island, was an audacious … Continue reading Evolution of NYC
This depiction from Popsci article Strategies for a Changing Planet: Water caught my eye: The sphere on the right shows all the water available on Earth, to scale. Astonishing! Click trough to Popsci to read about the challenges climate change poses to us through shifting the allocation of (a mostly constant amount of) water to different … Continue reading Earth’s water supply visualised
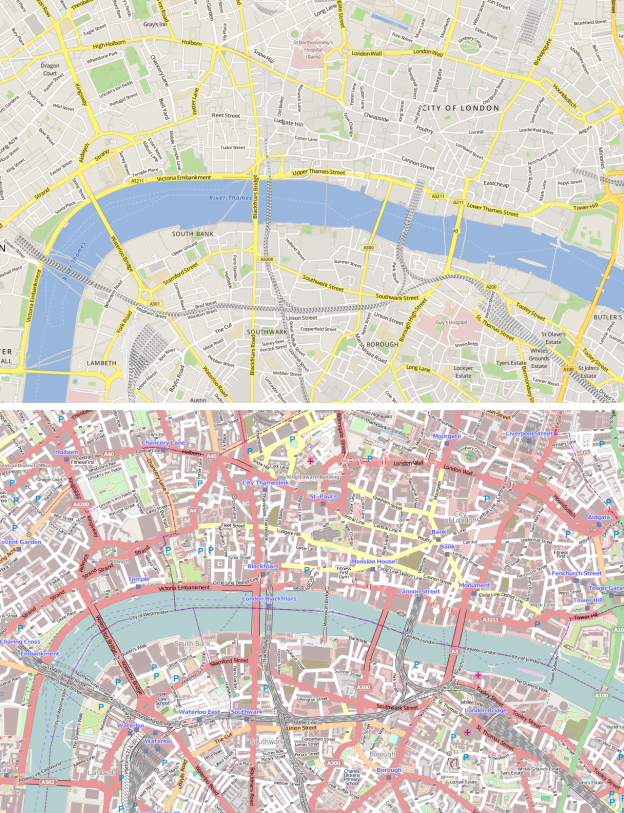
Skobbler produces apps and maps based on OpenStreetMap (OSM) data. Under http://maps.skobbler.com they’ve released an OSM-based map. I’ve always had mixed feelings about how OSM presented their map online. While I like the project very much and on and off use OSM data in my projects, I don’t like many things about the visual style both of … Continue reading Skobbler’s OSM map
Today in miscellaneous news: Open government data Zurich briefing: Today I’ve been at a preliminary open government data briefing by eZurich, an initiative to promote the IT industry in the city of Zurich, Switzerland. Zurich will be the first Swiss city (actually the first Swiss administrative body at all) to adopt an open government data … Continue reading Miscellaneous news of 2012-06-07
I’ve highlighted the NY Times’ Opinionator blog before. Back then, Franc Jacobs wrote a piece about the delimitation of the rather fuzzy geographic entity called “Europe”.
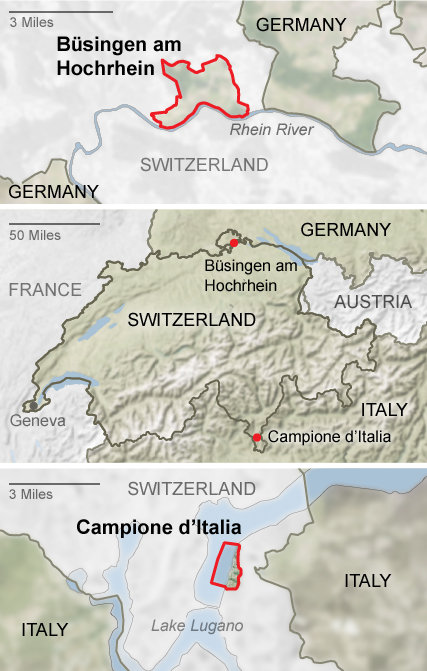
Today, there’s a new blog post about Enclave Hunting in Switzerland. After the mandatory clichées (the relevance of the “National Yodeling Festival” can probably be gleaned from the fact that it takes place only “once every three years”… – as opposed to, say, the Montreux Jazz Festival), the piece gets more interesting when it explores the many national (intercantonal) and in fact two international enclaves of Switzerland. The curious topology of the two Appenzells and Sankt Gallen are dealt with as well as the enclaves of e.g. Fribourg and Geneva.
The two international enclaves of Switzerland: Büsingen and Campione (Source: NY Times)
I’ve previously talked very briefly about scraping tabular data from the web. That post pointed to a nice shortcut by Tony Hirst of OUseful.Info to import a HTML table into a Google Spreadsheet. In one of his most recent posts Tony Hirst goes into some detail with regards to using tabular data in Excel’s XLS format (not … Continue reading How to work with Excel XLS files outside of Excel
Creativity is just connecting things. When you ask creative people how they did something, they feel a little guilty because they didn’t really do it, they just saw something. It seemed obvious to them after a while. Steve Jobs, 1996 Compare to Everything is a Remix. (via Swissmiss) Continue reading Creativity
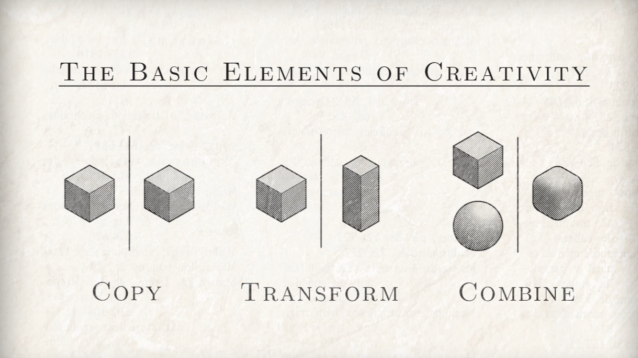
If you’re into creativity, you may have heard about Everything is a Remix. Its premise is that many things we consider original ideas are rather derivatives or combinations of existing ideas. It all comes down to COPY — TRANSFORM — COMBINE Everything is a Remix is a four-part video series which digs into the creative process. I’ve … Continue reading “Everything is a remix”, presumably also this title
I acknowledge, it’s been rather quiet in these regions of the web. Why, you ask? I have been rather busy with a sort-of spinoff project I pursue with two friends. After having published about the Twitter network of journalists here, here and here, I directed my interest towards politicians. With two friends, Tom Wider and … Continue reading Where was I?
A bit more than a week ago I published the Twitter network of (mostly Switzerland-based) journalists and a post about the mechanics behind the visualization. Here is what happened after that: In the first six hours after posting, the tweeting journalists’ network post has seen 800+ hits. Until today the post has been viewed 1,529 times, … Continue reading Tweeting Journalists: Aftermath