Updated global GeoHipster map
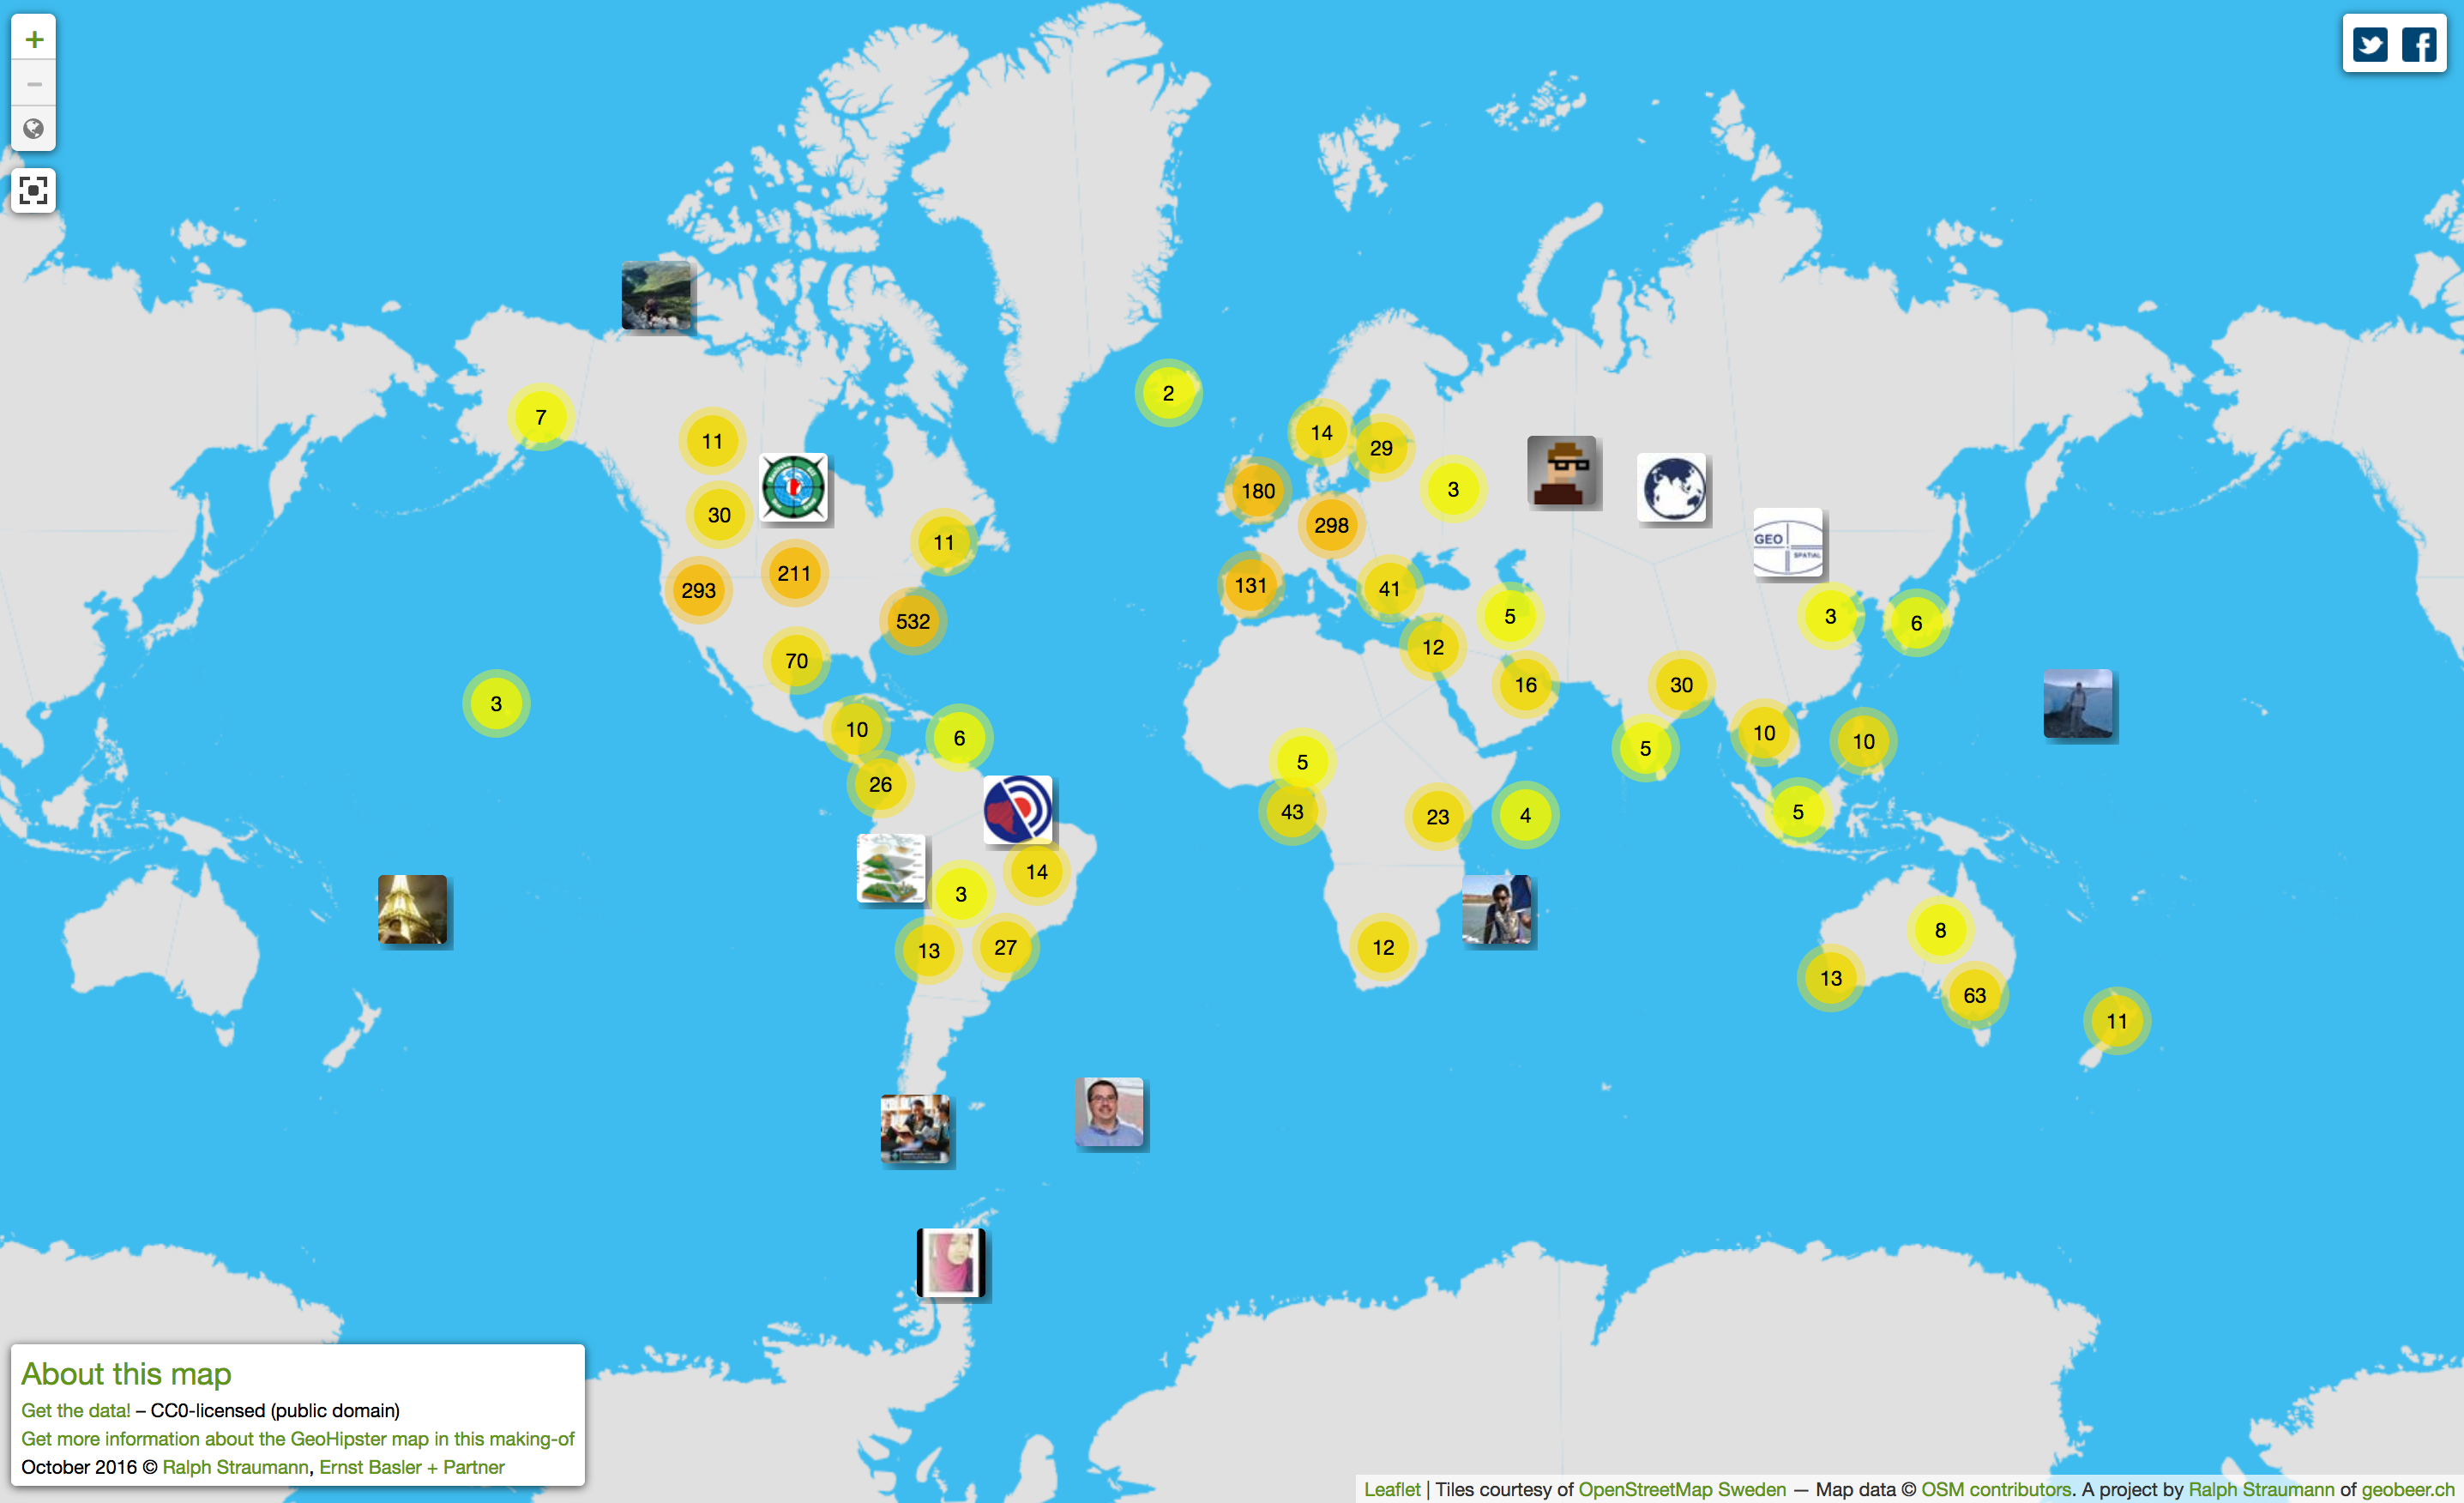
I’ve updated the GeoHipster Map, i.e. the map of the followers of @GeoHipster that I initially published in 2014. Of course, this map is not to be confused with the authoritative Map of GeoHipster Sightings over at the headquarter. Mine is like the theoretical spatial distribution in equilibrium state, the Sighting Map is conceptually closer … Continue reading Updated global GeoHipster map